

Telegraf to M3 to Grafana® Example#
Aiven for M3 + Telegraf set up#
At a high level, here’s how to set up Telegraf to push metrics to Aiven for M3.
Create Aiven for M3 Service
Install and configure Telegraf Agent
Setup Aiven for Grafana® instance for visualization of telegraph metrics
Enjoy the fruits of your labor!
Create Aiven for M3 service#
If you don’t have an existing Aiven account, please follow this link to sign up for a free 30 day trial with $300 of credits: https://console.aiven.io/signup
Within your existing Aiven project, create a new M3 service.
Under Create Service, select M3.
Select a cloud provider
Select a region
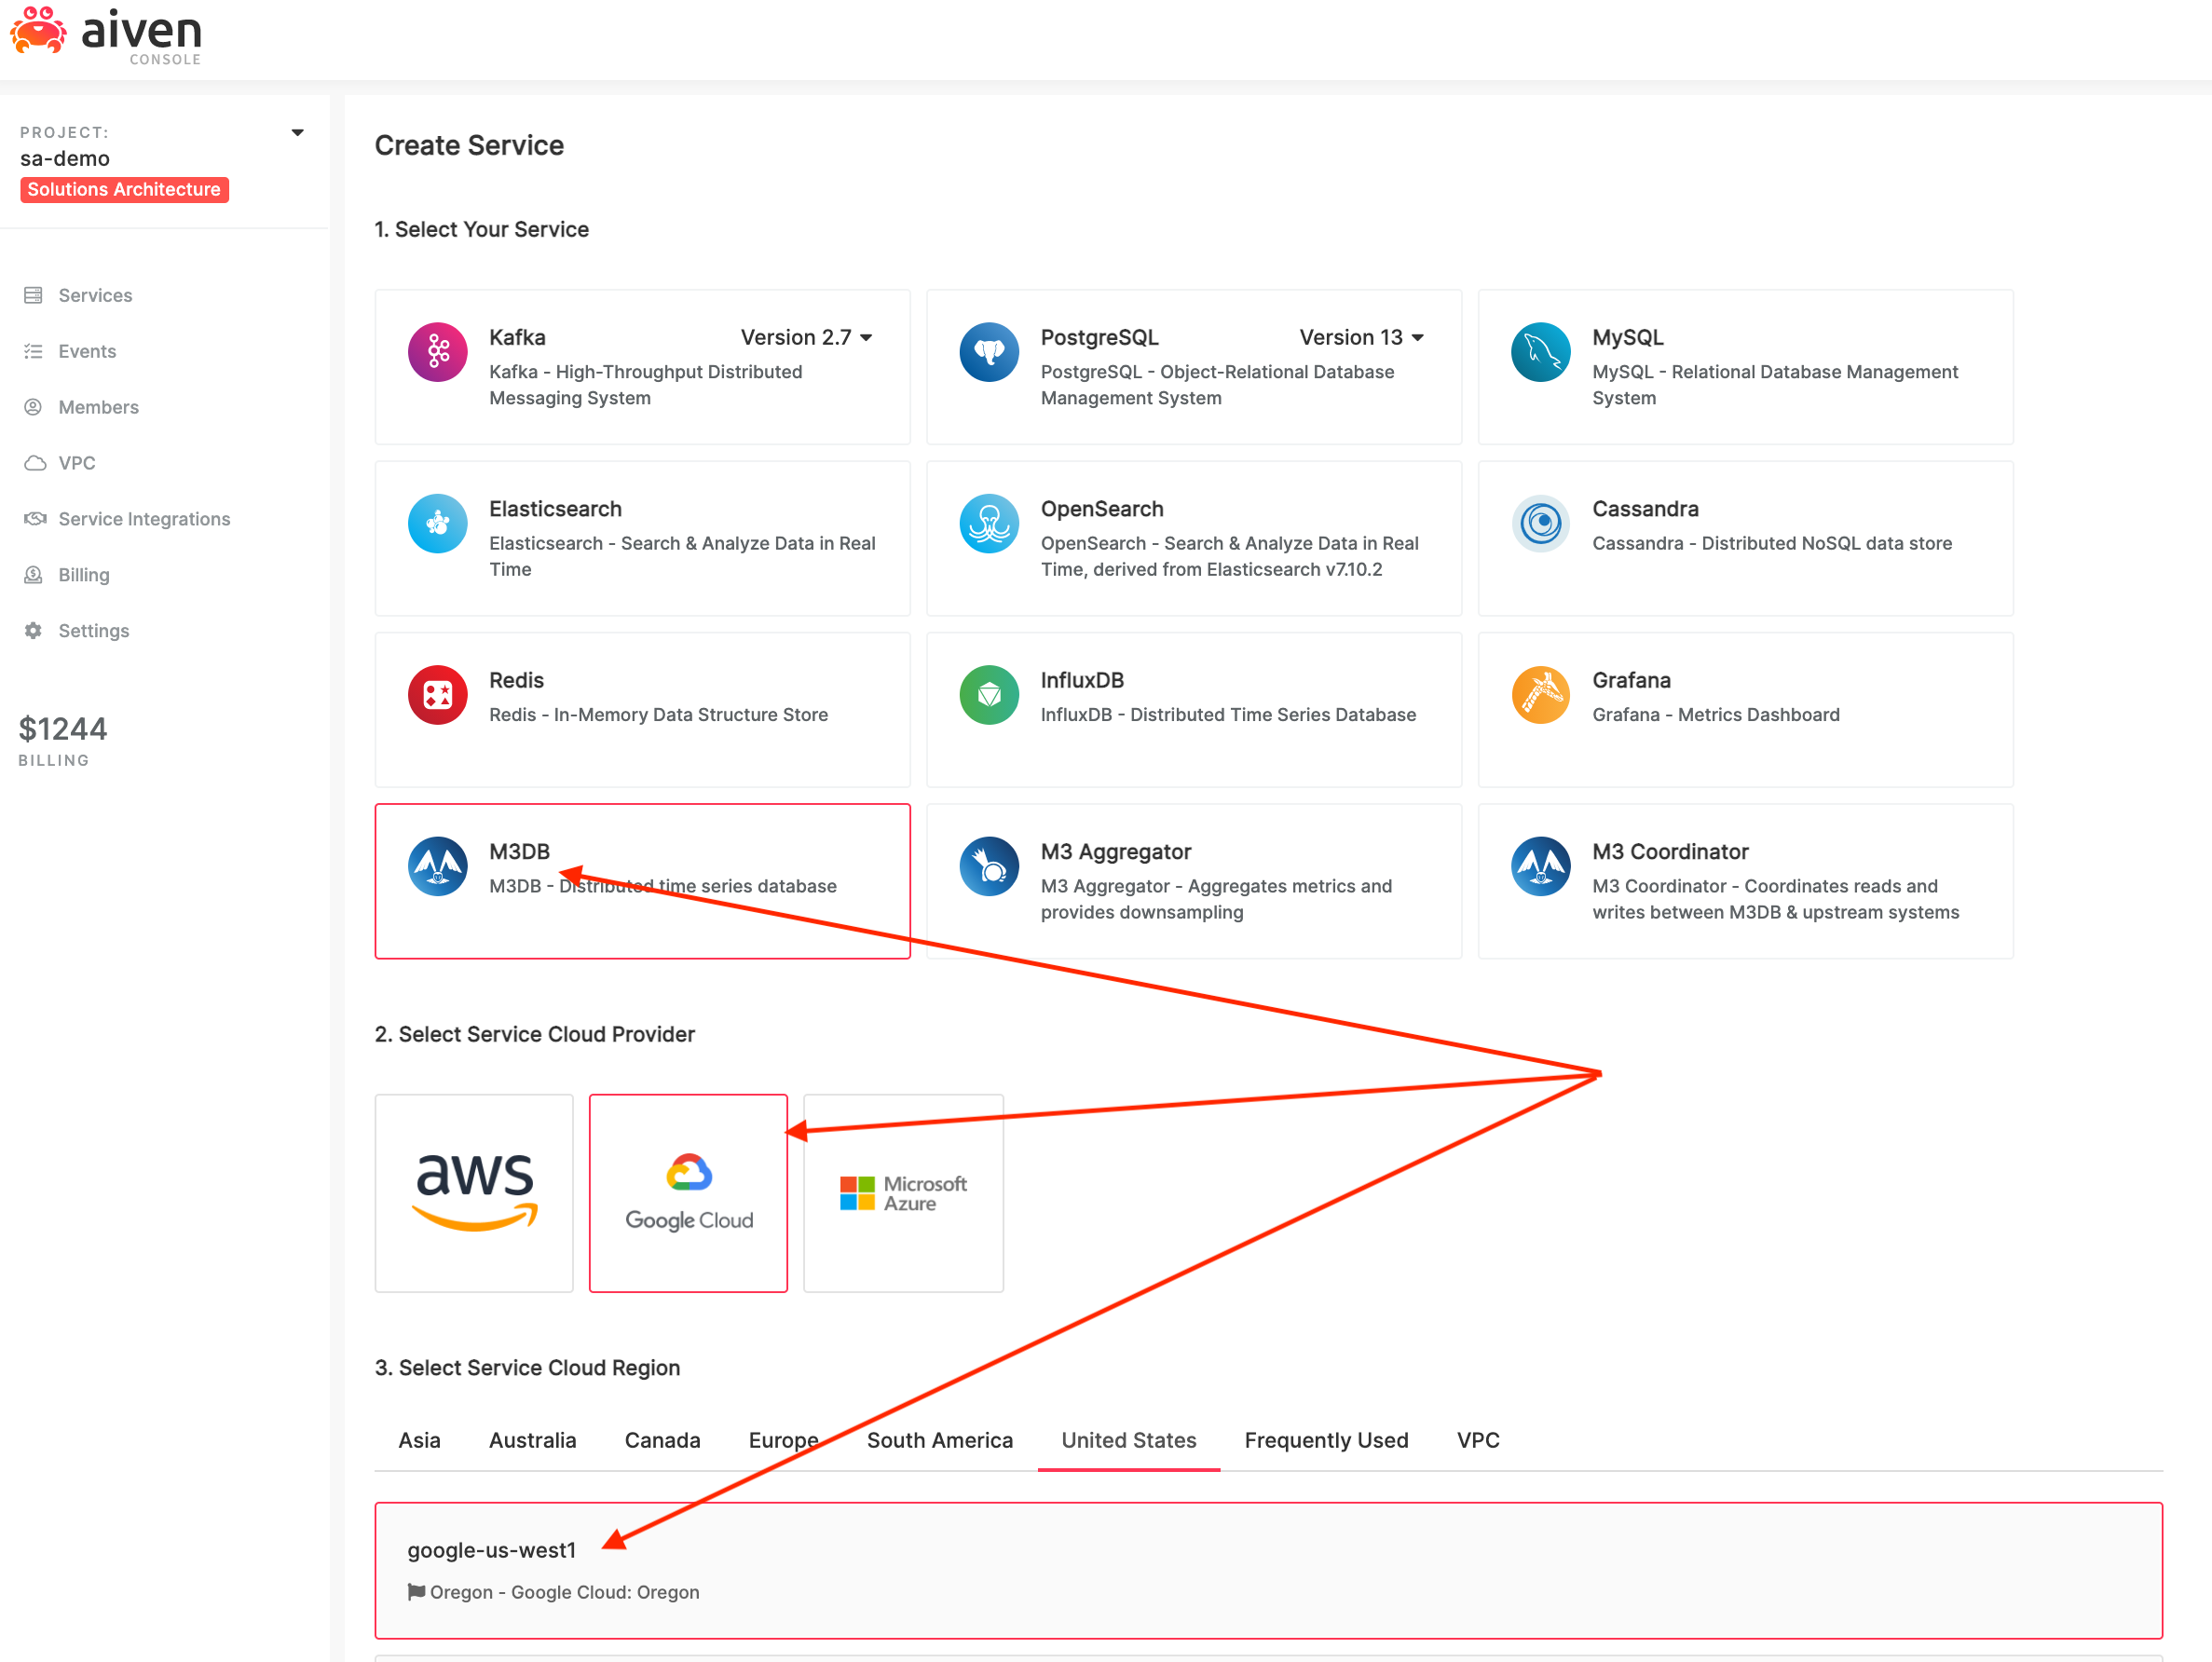
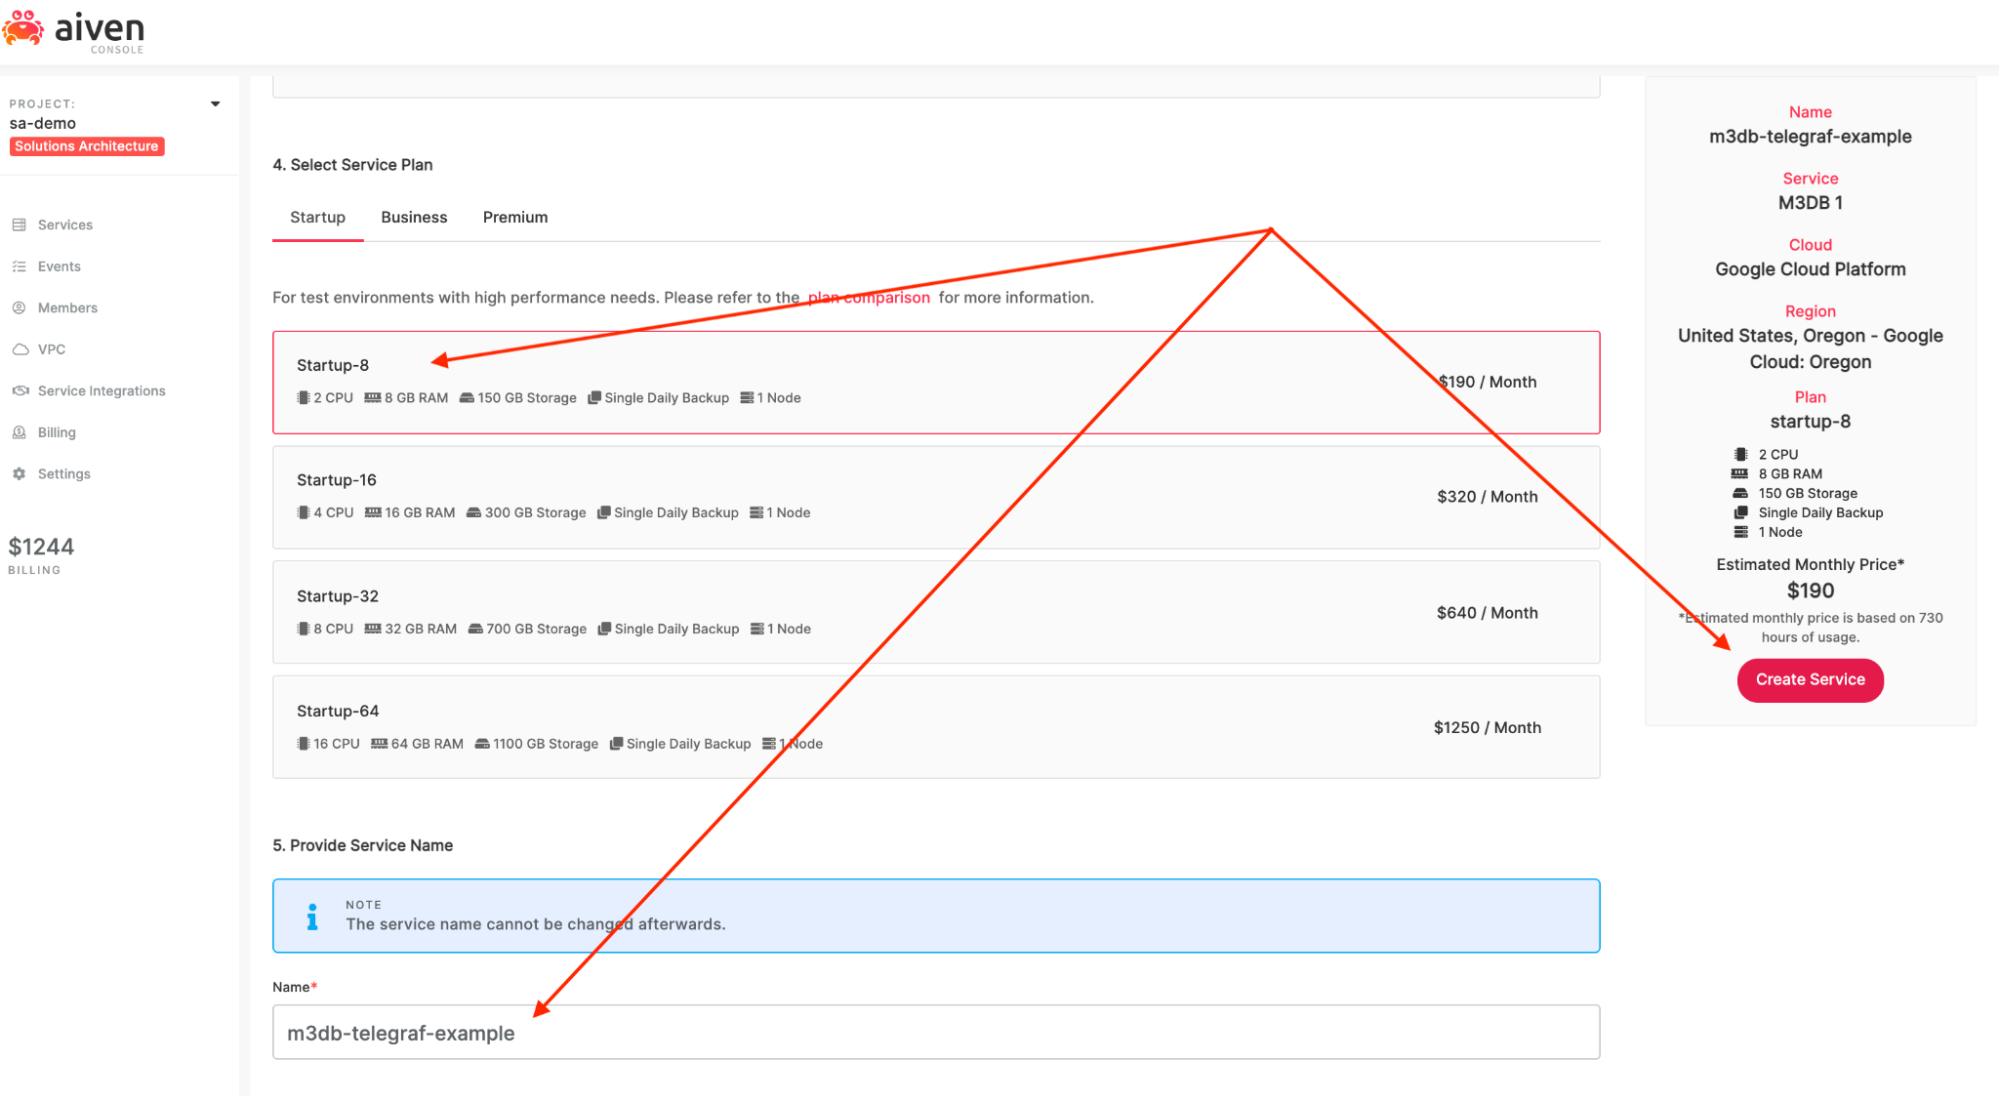
Select a service plan type. Startup-8 will be fine for this demo.
Tip
Aiven never charges for networking costs. What you see for the price is what you will pay at the end of the month!
Enter a name for the service.
Click the Create Service button.
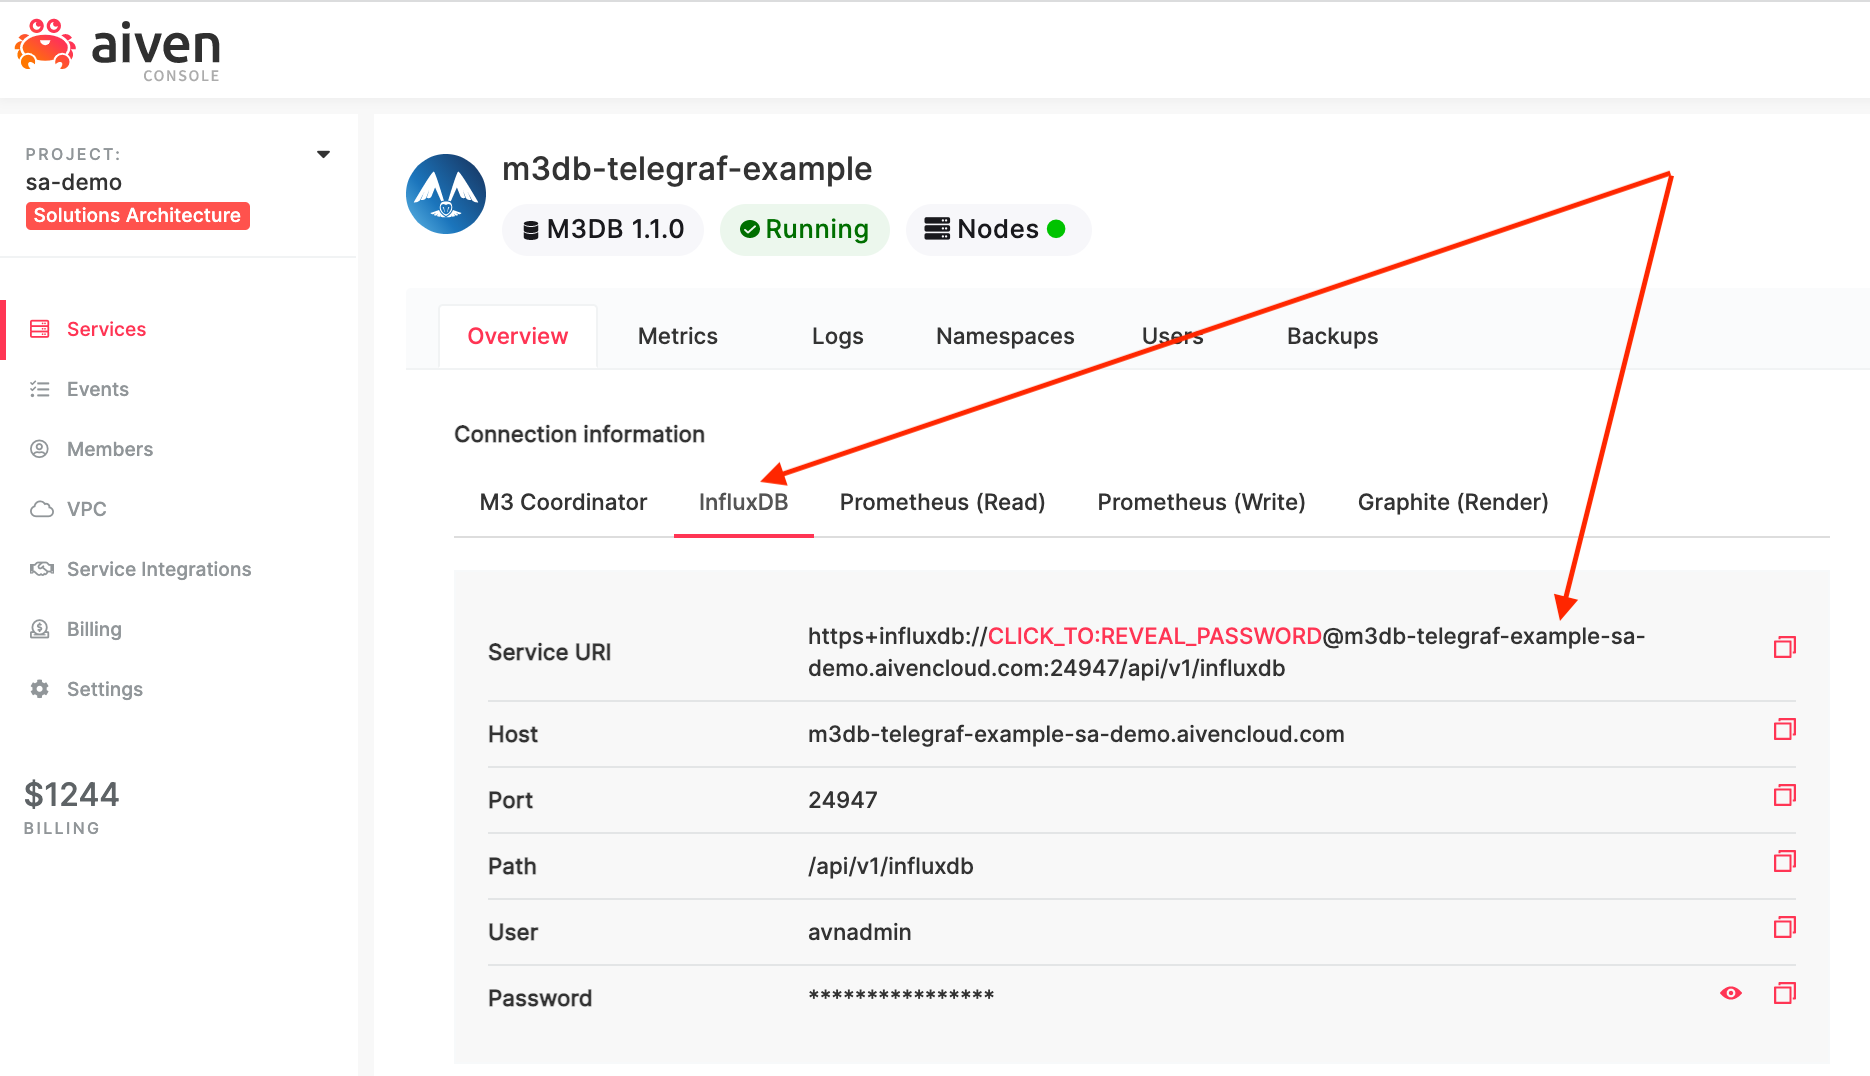
Navigate to the newly created M3 service via the left-side menu and the service listing, and click the InfluxDB® tab. You will use several values from this page including the Service URI, user, and password when configuring Telegraf in the next section of this blog.
Install Telegraf#
To simplify this example, we will install the Telegraf agent on a MacBook to collect the system metrics. Of course, Telegraf can also be installed on Windows and Linux machines.
Assuming you have Homebrew installed on a MacBook, simply run the following command at the Terminal to install Telegraf (https://formulae.brew.sh/formula/telegraf):
brew update && brew install telegraf
Configure Telegraf and integrate it with M3#
Use the Telegraf agent to generate a default configuration file for editing:
telegraf config > telegraf.conf
Modify the telegraf.conf configuration file to change the output endpoint to that of our M3 instance.
Change the URL under the outputs.influxdb section to that of your Aiven for M3 service (see above).
NOTE: The URL prefix should simply be https:// and remove the username:password from the URI (see snippet below).
Specify the service username/password and set the database name to default
(the database that is automatically created when your service is provisioned):
[[outputs.influxdb]]
  urls = ["https://my-M3-service-my-project.aivencloud.com:24947/api/v1/influxdb"]
  database = "default"
  skip_database_creation = true
  username = "avnadmin"
  password = "my_service_password"
Finally, start Telegraf using the configuration file and begin sending system metrics to M3 by running the command below:
telegraf -config telegraf.conf
Wait 10 seconds or so (the default collection interval) to see if there are any error messages displayed in the terminal:
MacBook-Pro tmp % telegraf -config telegraf.conf
2021-10-08T01:21:15Z I! Starting Telegraf 1.20.1
2021-10-08T01:21:15Z I! Loaded inputs: cpu disk diskio kernel mem processes swap system
2021-10-08T01:21:15Z I! Loaded aggregators:
2021-10-08T01:21:15Z I! Loaded processors:
2021-10-08T01:21:15Z I! Loaded outputs: influxdb
2021-10-08T01:21:15Z I! Tags enabled: host=MacBook-Pro
2021-10-08T01:21:15Z I! [agent] Config: Interval:10s, Quiet:false, Hostname:"MacBook-Pro", Flush Interval:10s
Create Aiven for Grafana service#
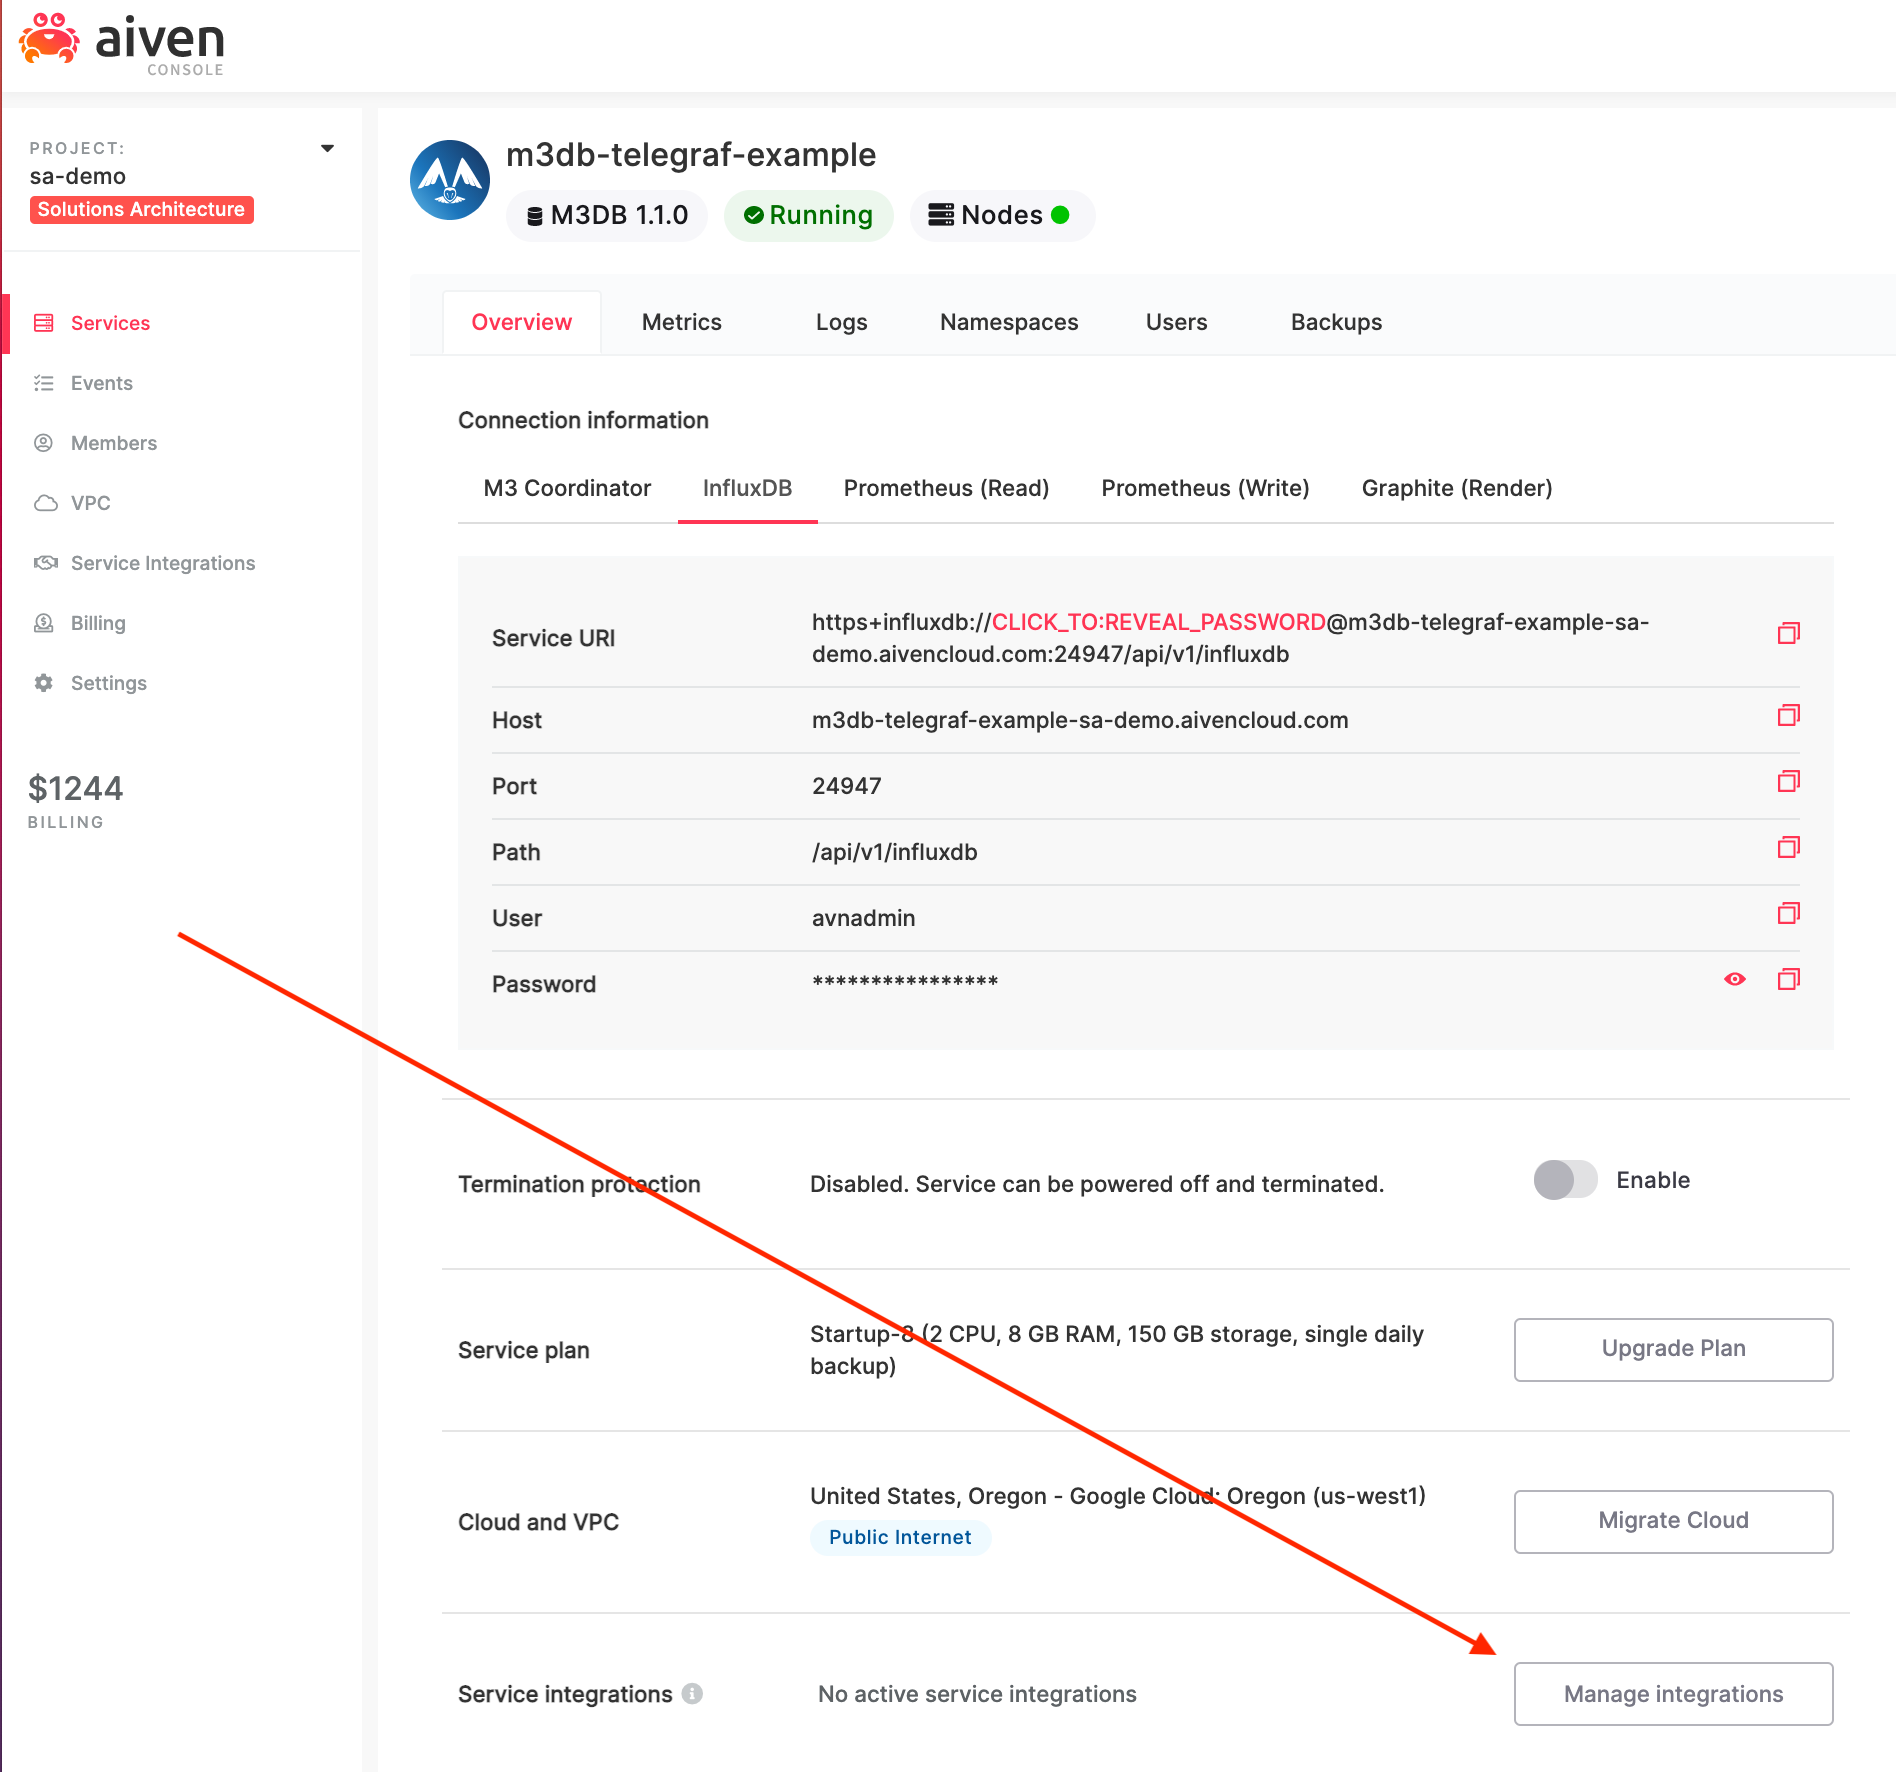
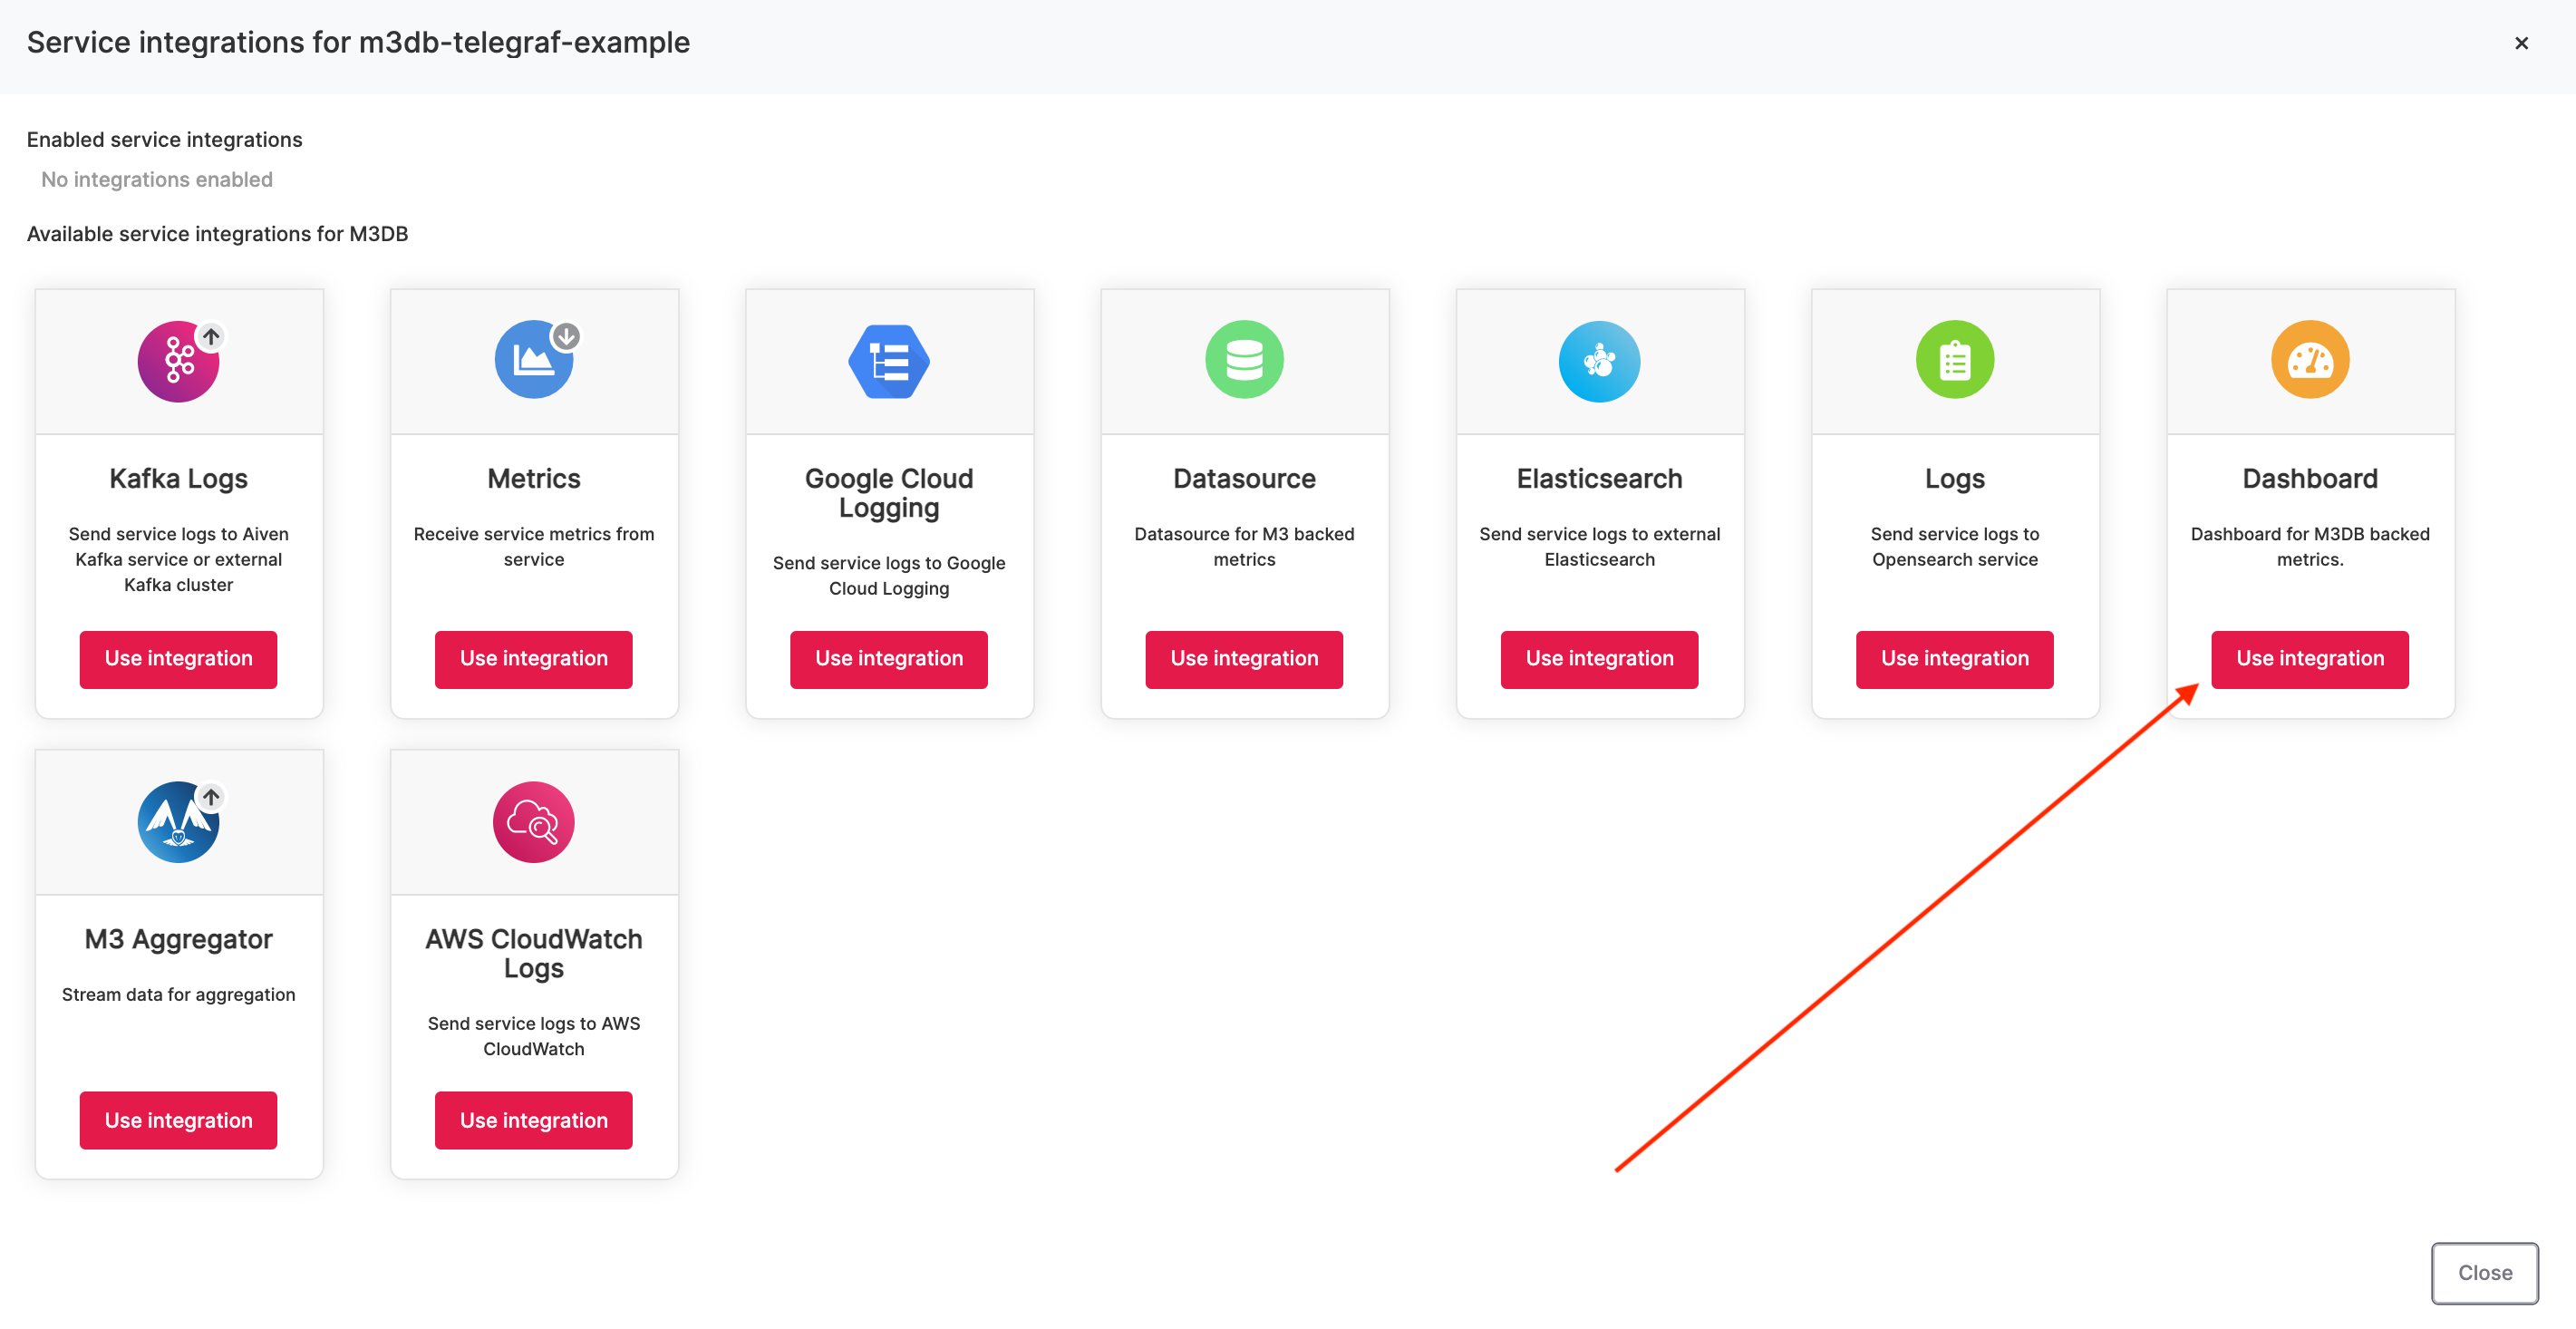
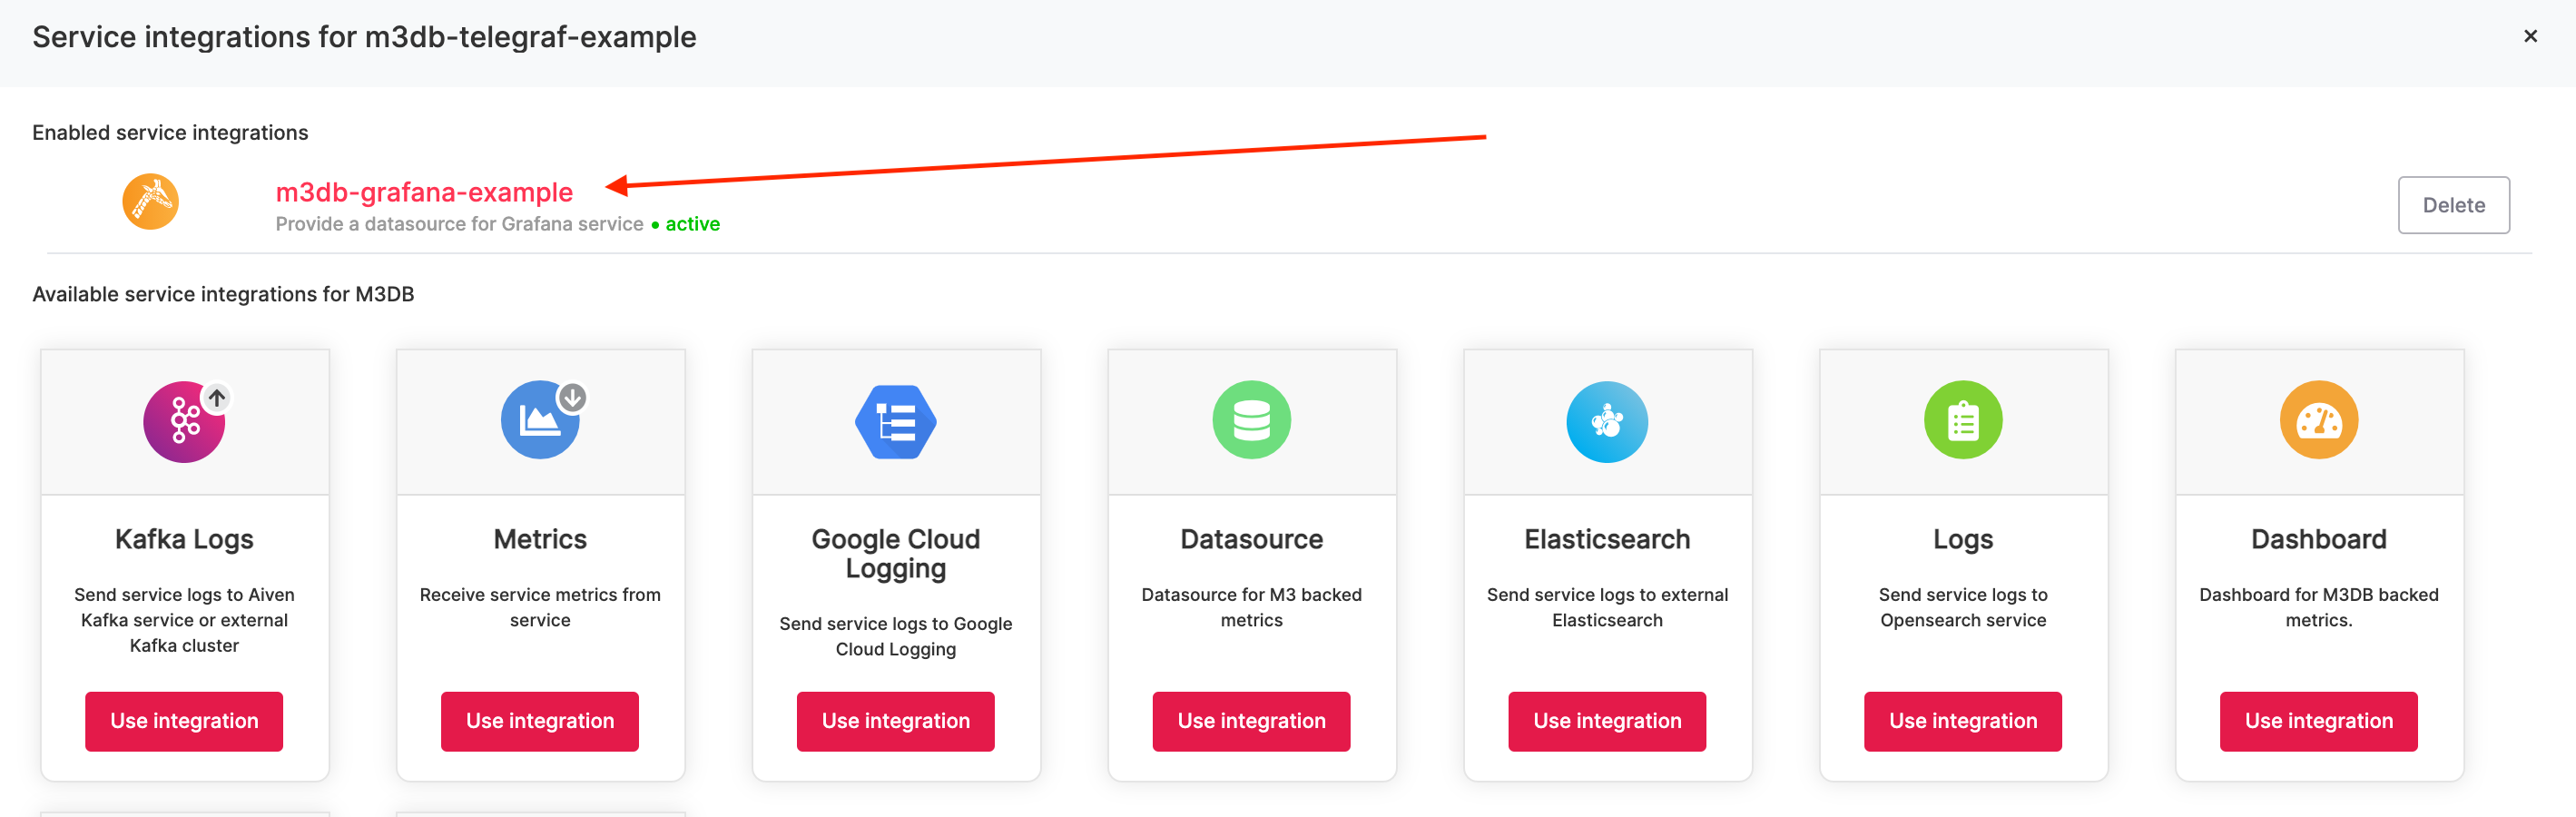
In the Aiven Console, navigate to the M3 service and click the ‘Manage integrations’. Connect your M3 instance to a new Grafana dashboard service.
Click the “Use Integrations” button on the Dashboard modal.
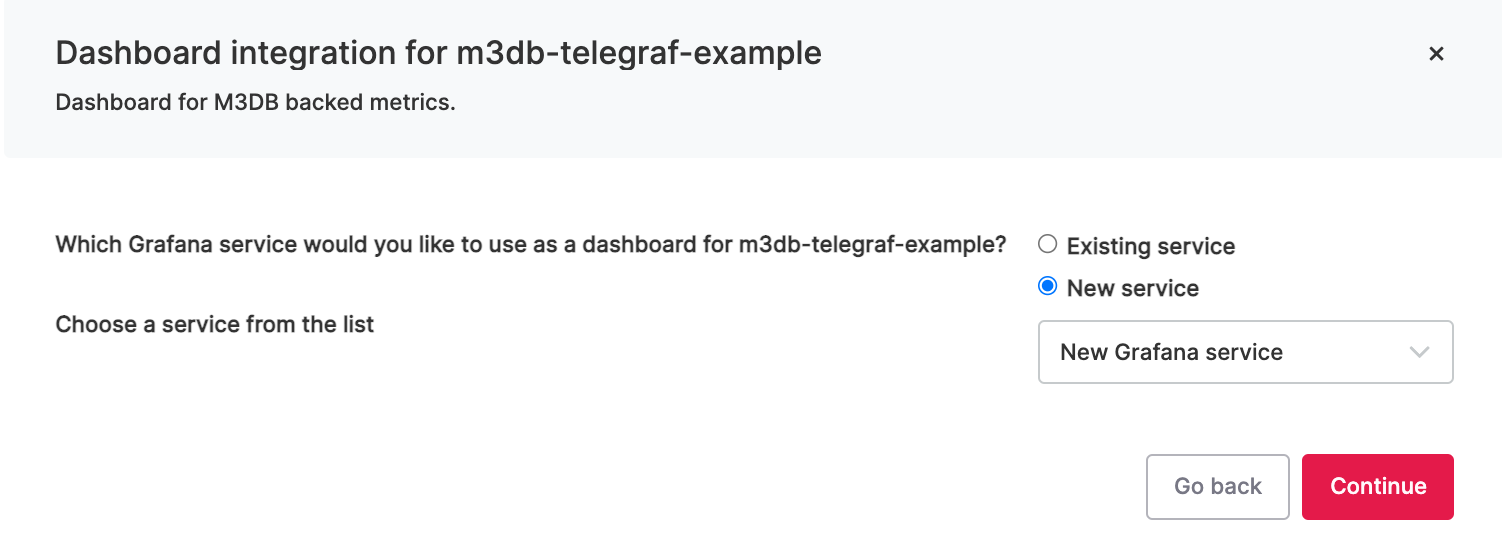
In the pop-up modal, select “New Service” and click the Continue button.
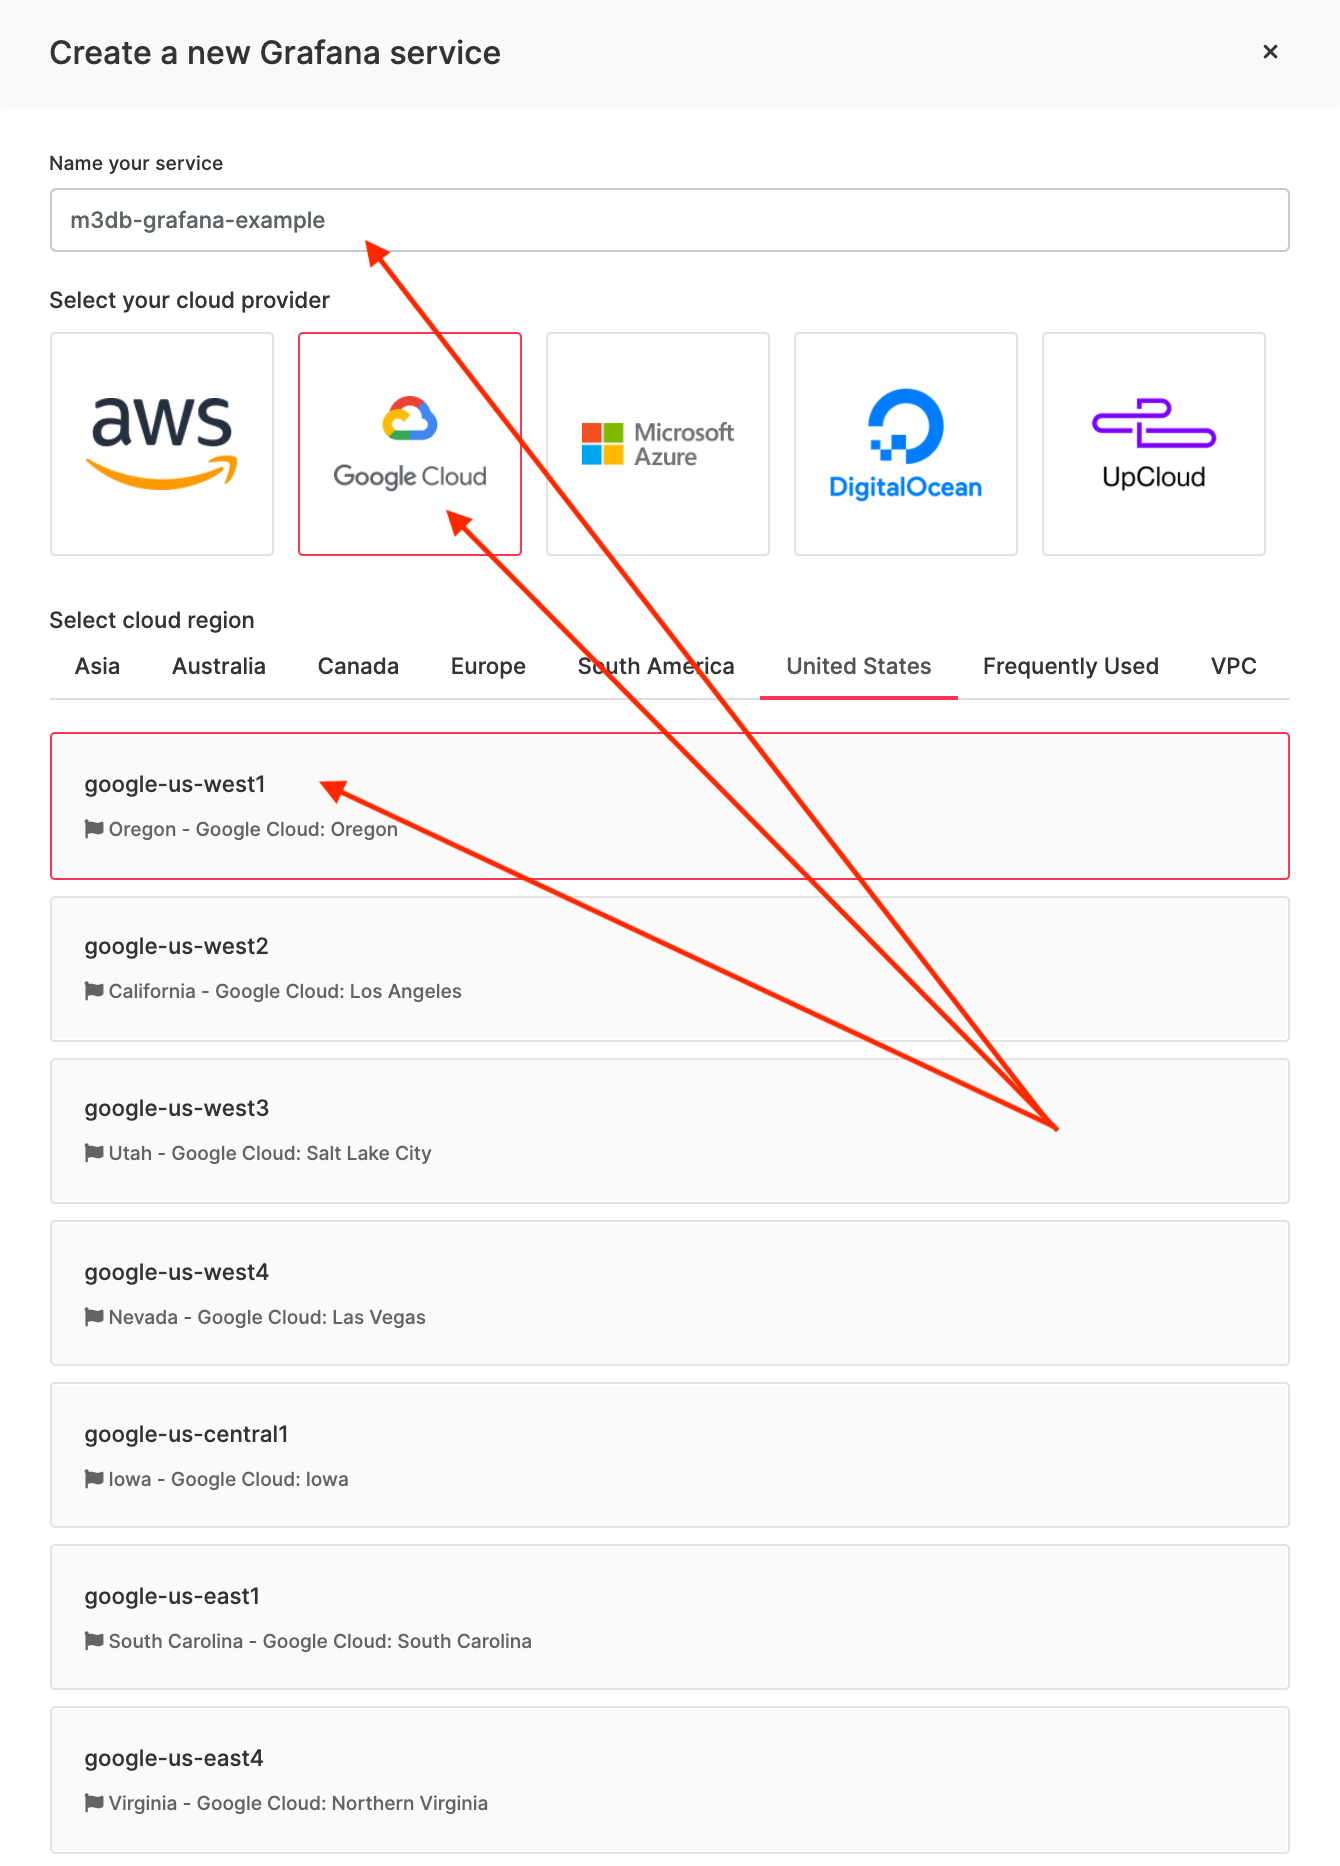
Follow similar steps to create the service by filling in the:
Name
Cloud
Region
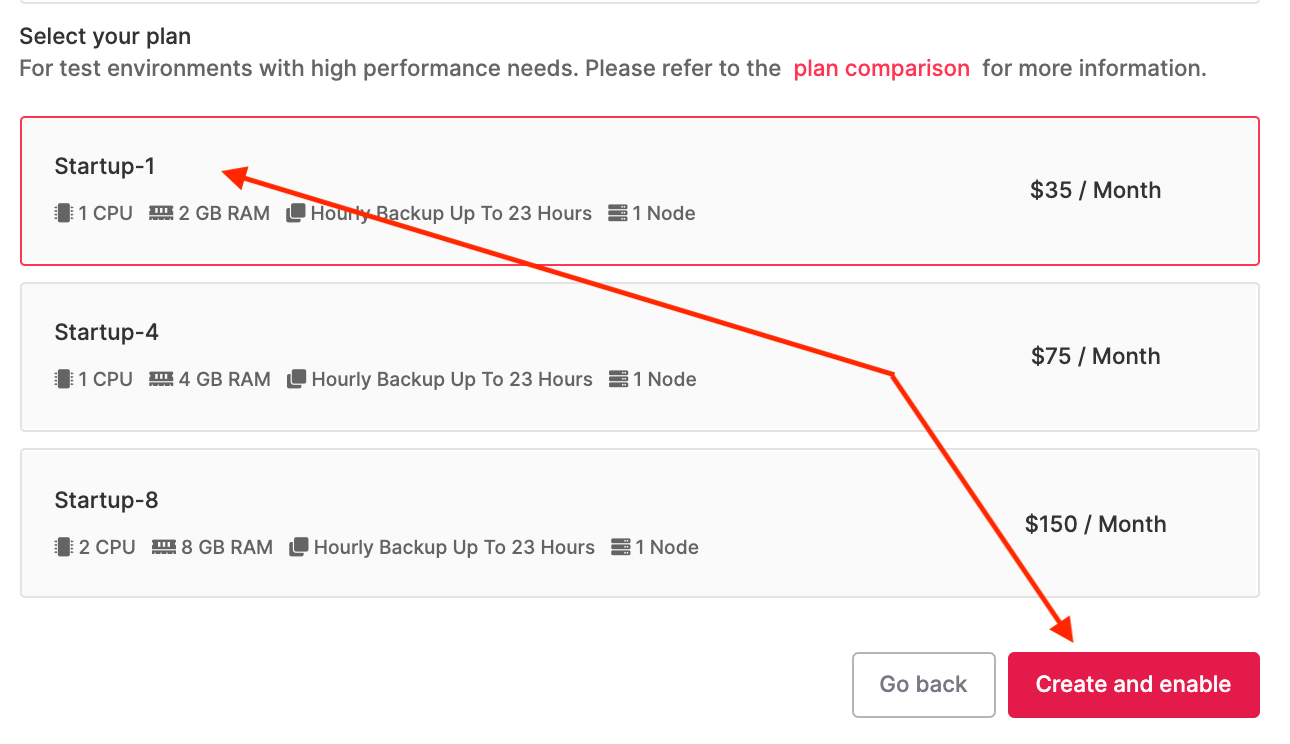
Service Plan (Startup-1 is OK)
And then click the Create and enable button.
A new Grafana service will now be starting up and automatically connect to the M3 database to display metrics.
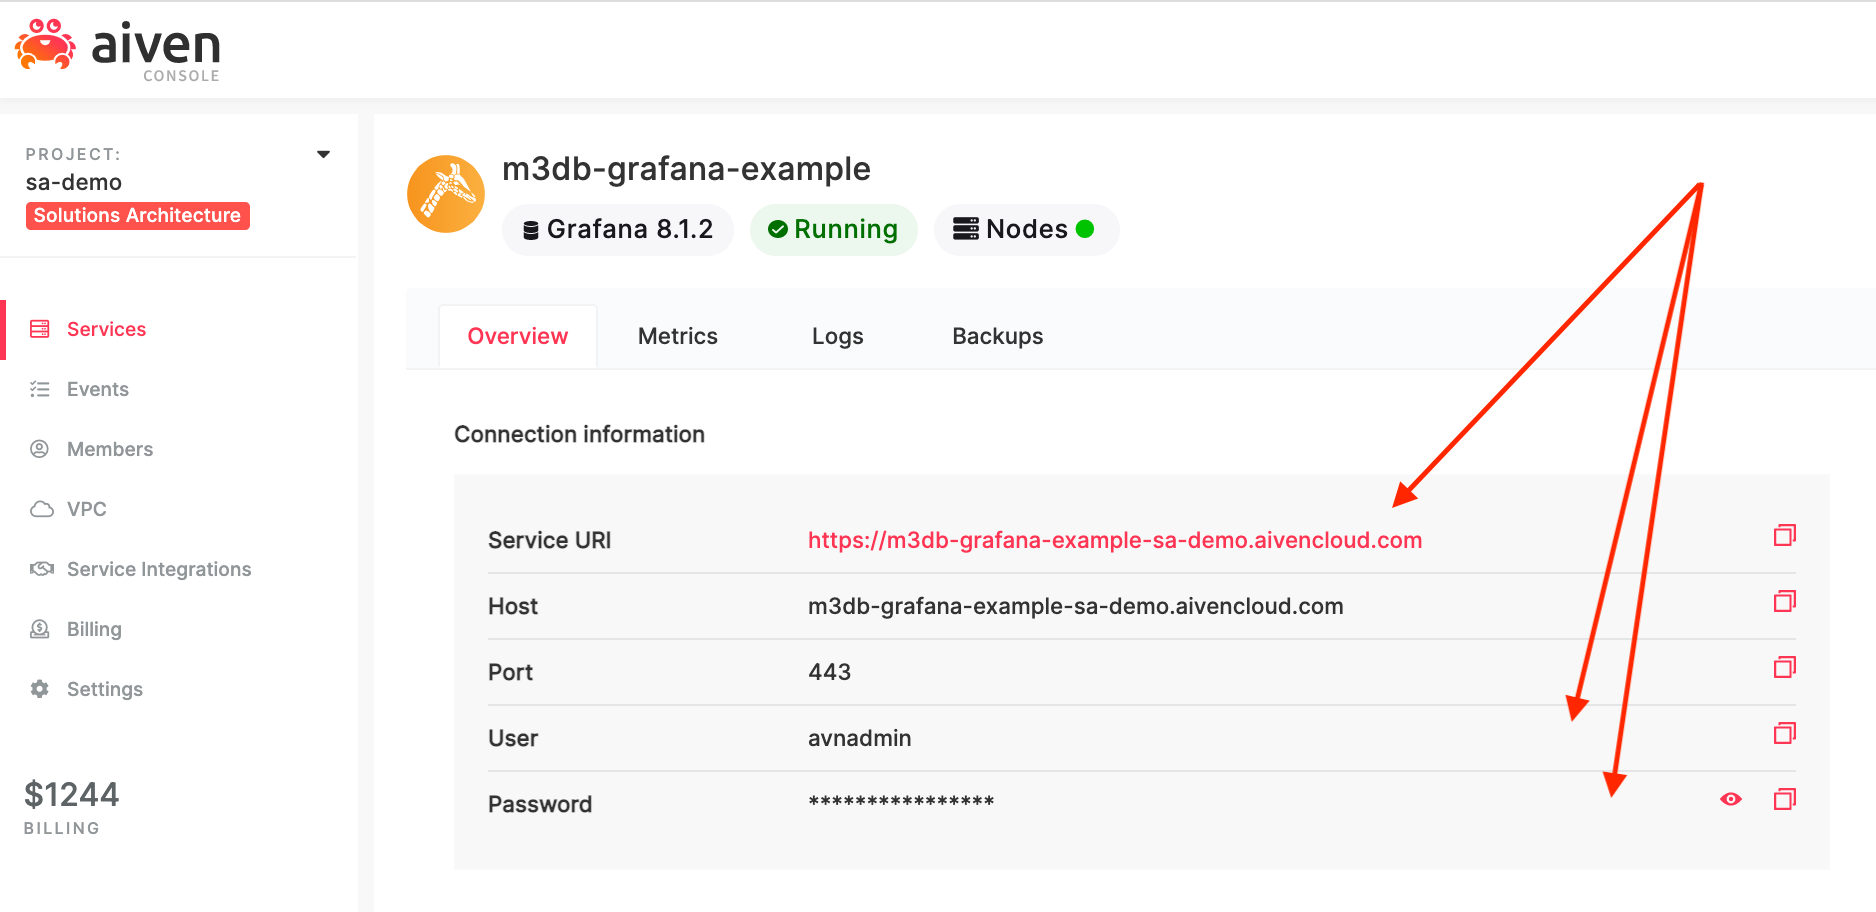
Click on the name of the service to navigate to the new service.
Once the service is running, click on the Service URI and login with the user / password from the connection information.
Visualizing metrics#
Now to what we all have been waiting for, the Metrics!
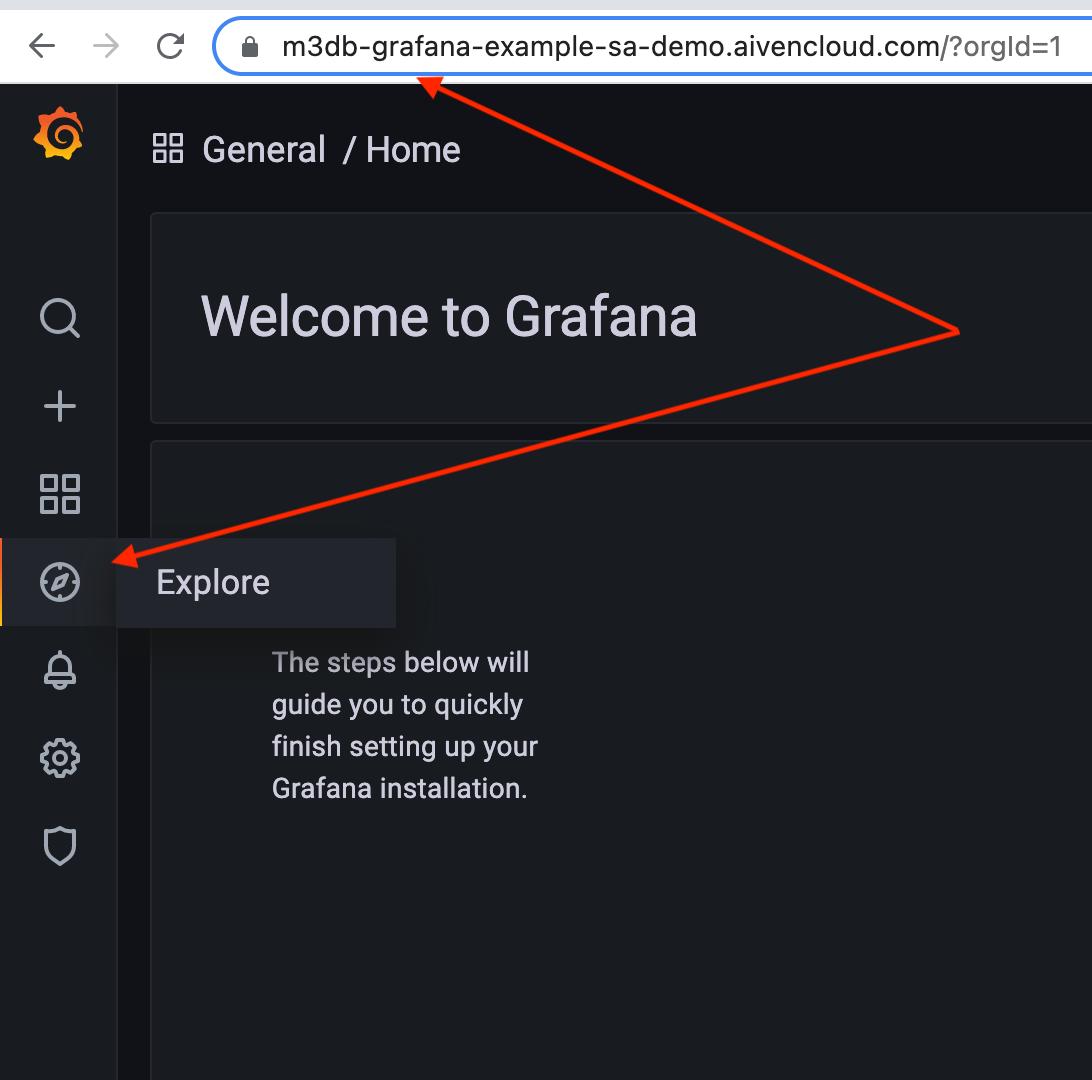
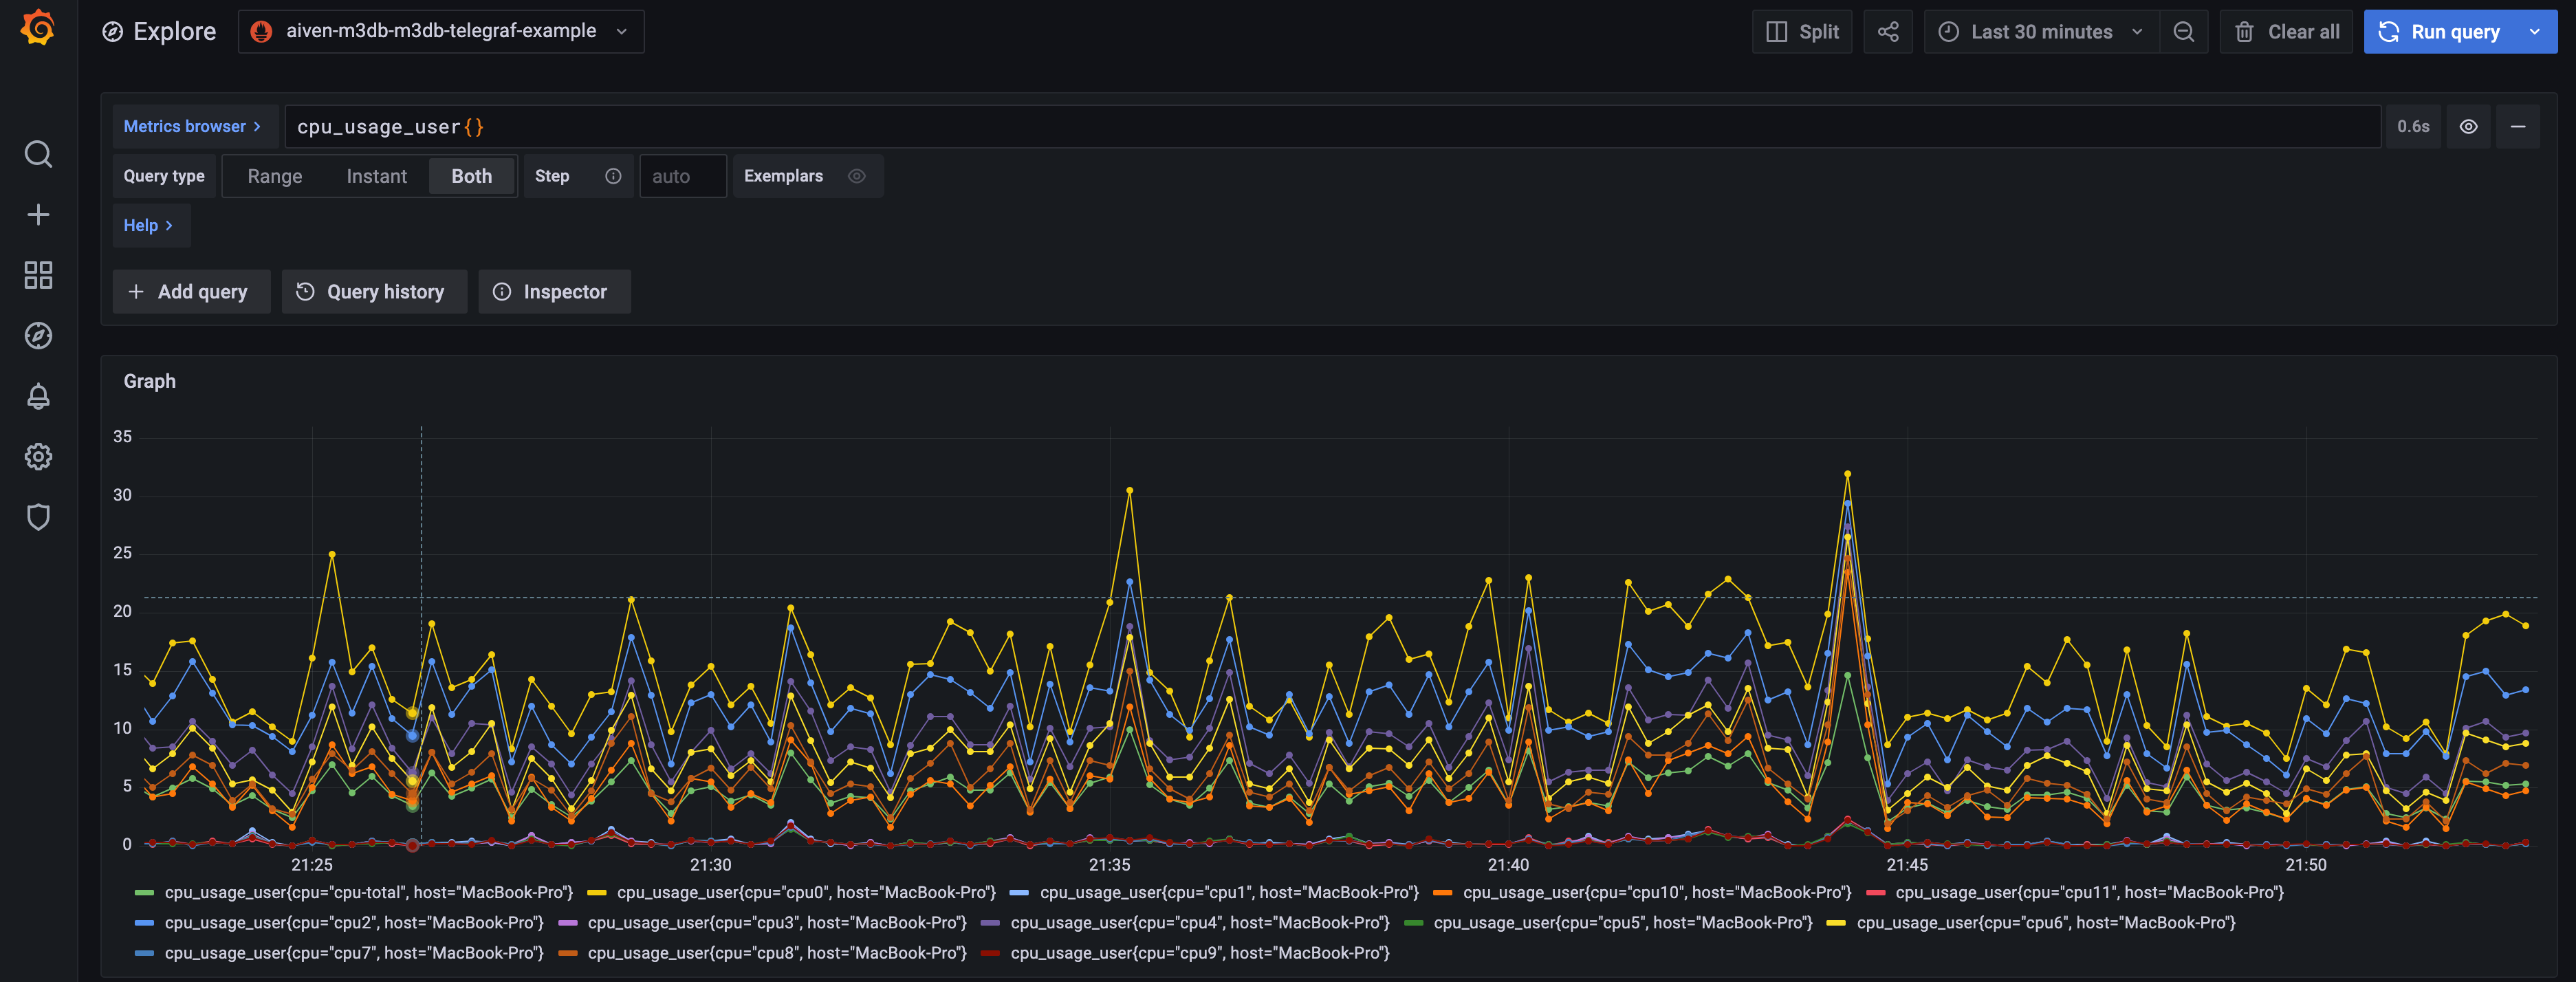
In the Grafana dashboard, click the Explore tab.
Select your M3 service as the data source from the drop down menu at the top of the page.
Click the metrics browser, select cpu_usage_user, and then click the “Use Query” button.
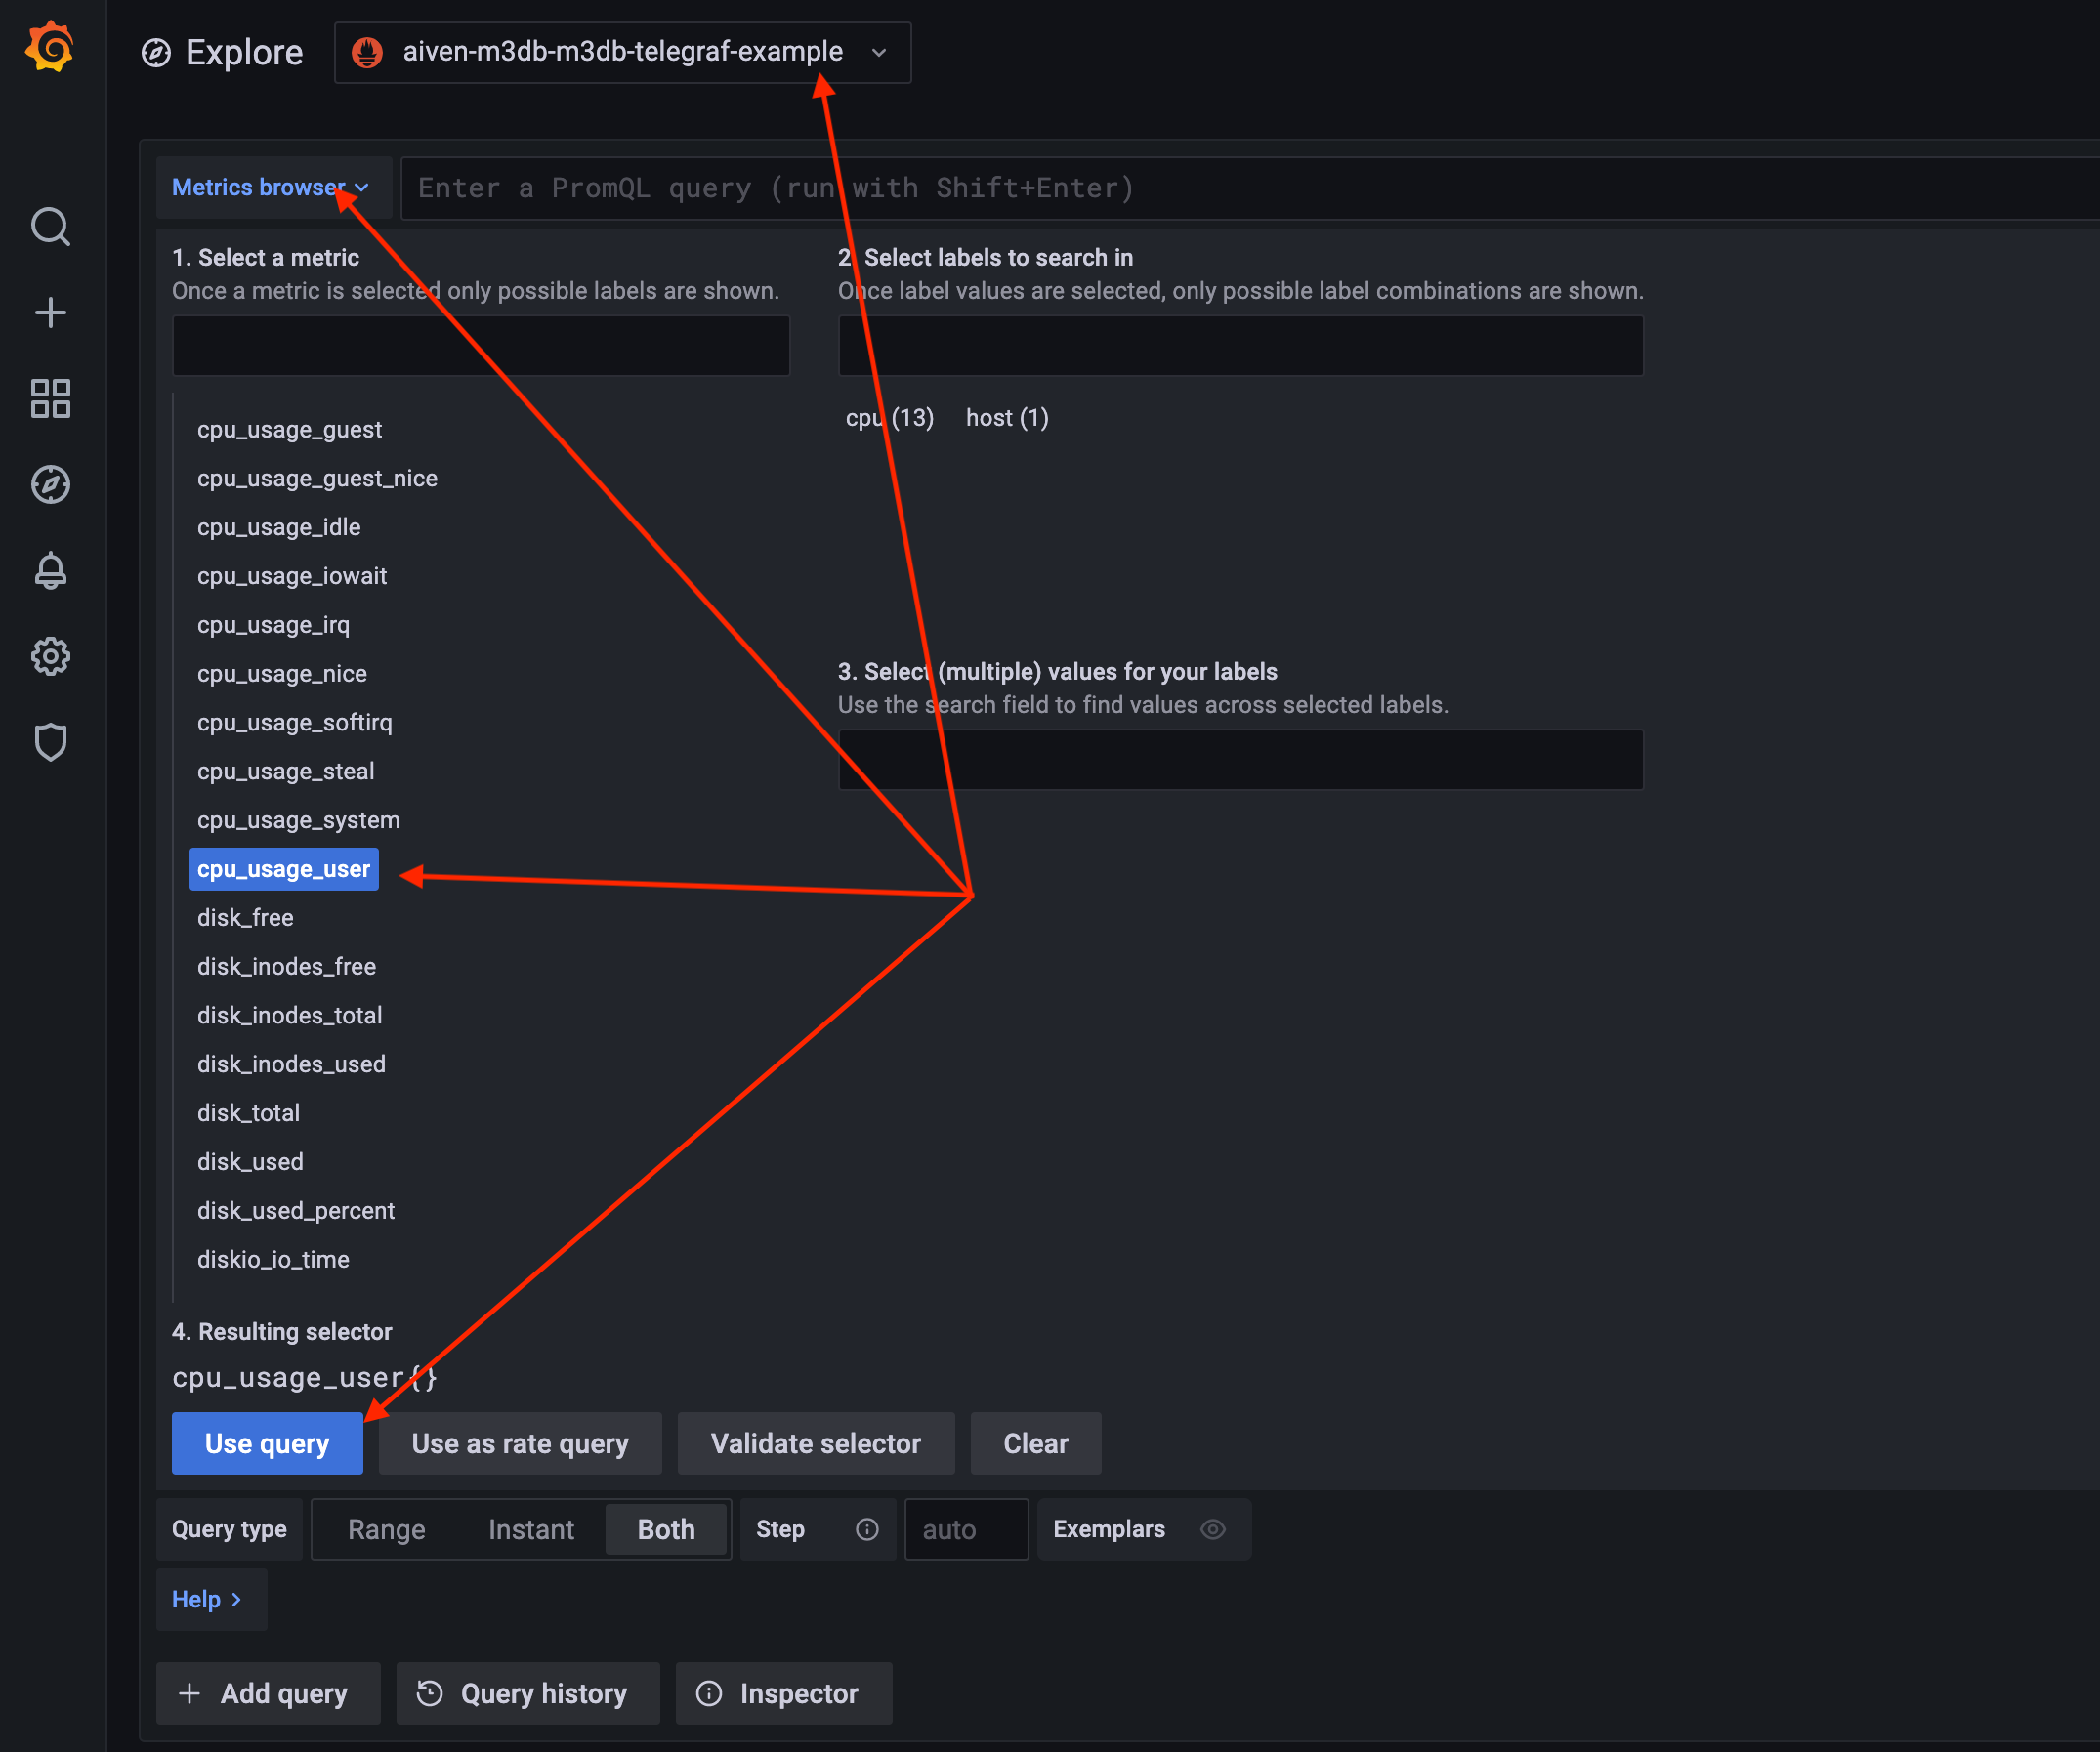
The chart displayed below represents the CPU of the MacBook.
Tear Down
At the terminal, press Ctrl+C to stop the Telegraf agent. Then, delete your M3 and Grafana services within the Aiven Console.