

Use Prometheus with Aiven#
Prometheus is an open-source systems monitoring and alerting toolkit. It implements an in-memory and persistent storage model for metrics as well as a query language for accessing the metrics.
The metrics delivery model of Prometheus is a pull model where the Prometheus server connects to HTTP servers running on the nodes being monitored and pulls the metrics from them. While this makes the service discovery more of an challenge than using the more common push approach, it does have the benefit of making the metrics available not just for Prometheus but for any app that can read the Prometheus format from the HTTP server running on Aiven nodes.
Enable Prometheus support on your Aiven project#
Aiven offers Prometheus endpoints for your services. To enable this feature, follow the steps below:
- Navigate to the project Integration endpoints page.
- Add a
Prometheusintegration endpoint if one does not already exist.Usually you only need one of these per project (as it can be used for all services in the same project) so if you can see one has already been created then you can skip this step. - Navigate to your service that you would like to monitor and click
Manage integrations - Choose the
Prometheusservice integration by clickingUse integration - Confirm you have selected the Prometheus endpoint configured earlier in step 2 and click
Enable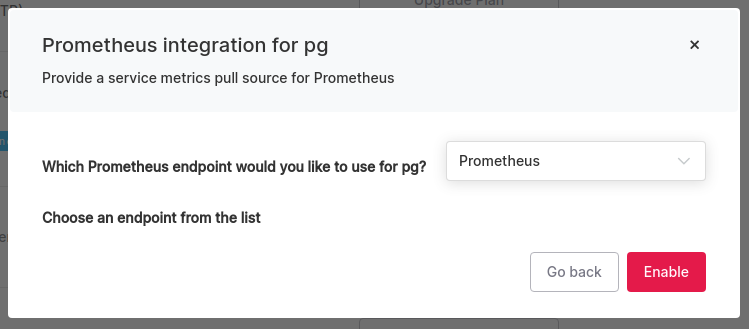
- Check the service overview page to see that the integration has been successfully enabled and is now
Active - Copy the Prometheus connection information found from the top of the service overview page under the new
Prometheustab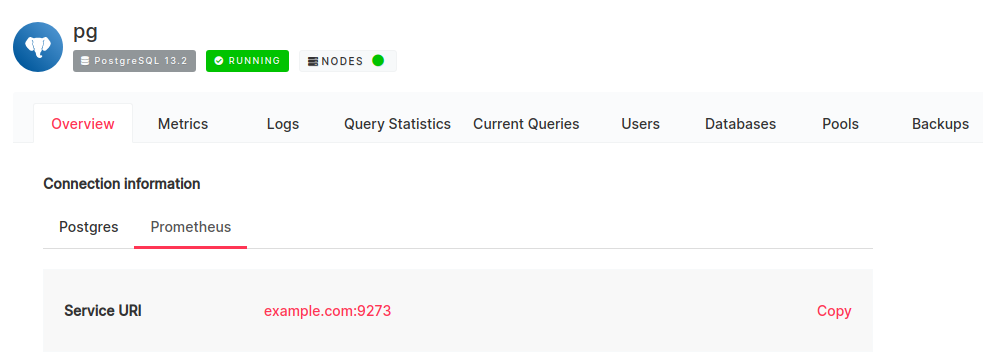
At this point, the system will start an HTTP server on all nodes of the service that provide access to the metrics. Note that there can be roughly one minute delay until the metrics are available.
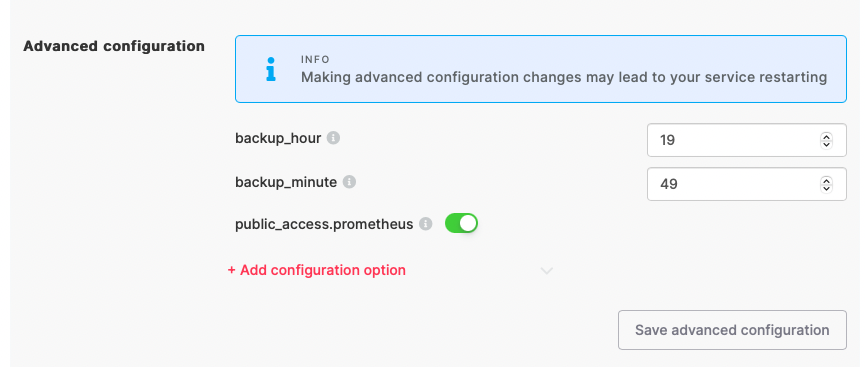
Accessing Prometheus in a VPC#
If you use a VPC in your projects, then the property
public_access.prometheus needs to be enabled in the Advanced
Configuration of the service whose metrics you want to access.
Configure Prometheus#
Now that Aiven is exposing endpoints for your services, add a scrape configuration to Prometheus for the servers you want to pull data from. The examples in this section show how to configure for both single-node and multiple-node services.
For services with a single node#
For single-node services, configure a scrape_config entry and the following settings:
Basic auth details can be found on the Prometheus tab of the Service Overview page.
The Service URI can also be found on the Prometheus tab of the Service Overview page.
The location of the CA cert; the certificates are signed by the Aiven project CA so you will need to download it from the Service Overview page.
Note
You can download the CA certificate using the
Aiven command line client
and the command avn project ca-get --target-filepath ca.pem
Your scrape_config job entry in prometheus.yml would look something like this:
scrape_configs:
  - job_name: aivenmetrics
    scheme: https
    basic_auth:
      username: <PROMETHEUS_USERNAME>
      password: <PROMETHEUS_PASSWORD>
    tls_config:
      ca_file: ca.pem
    static_configs:
      - targets: ["<PROMETHEUS_SERVICE_URI>:<PROMETHEUS_SERVICE_PORT"]
With the configuration in place, Prometheus will start pulling metrics from your services.
For services with multiple nodes#
For any services that consist of multiple nodes without a DNS name for each
node, use the dns_sd_configs option to define the servers with DNS type set
to A . This causes Prometheus to resolve all the IP addresses associated
with the DNS name and query all of those IP addresses directly. A side effect
of using this IP resolution is that Prometheus expects the TLS certificate to
be bound to the IP address of the hosts, not to the DNS name, so to make the
connection work you must enable the insecure_skip_verify setting. See the
below snippet for an example configuration.
scrape_configs:
  - job_name: aivenmetrics
    scheme: https
    basic_auth:
      username: <PROMETHEUS_USERNAME>
      password: <PROMETHEUS_PASSWORD>
    dns_sd_configs:
      - names:
          - <PROMETHEUS_SERVICE_URI>
        type: A
        port: <PROMETHEUS_SERVICE_PORT>
    tls_config:
      insecure_skip_verify: true
Note
For PostgreSQL® services with multiple nodes, the primary DNS name does not include standby IP addresses. To track those, make sure to include the replica DNS names in the list. If you have <PROMETHEUS_SERVICE_URI> as example.aivencloud.com, then you will need to add replica-example.aivencloud.com.
View full list of metrics#
Aiven provides the Prometheus client via the Telegraf plugin so all the same metrics that are available via the Aiven for InfluxDB® metrics integration are also available via the Prometheus integration. You can see the full list of metrics here.
Note
Note that for some services the metrics provided by different hosts may vary depending on the host role. Most notably for Kafka® only one of the nodes provides metrics related to consumer group offsets.
Other integrations#
Here are some links to learn more about integrations with Aiven: